RSS-канал «Forex analysis review»
Currency trading on the international financial Forex market
Обработано роботом:
2024-04-26 19:42:12
Пополнены новости:
2024-04-26 15:42:06
Доступ к архиву новостей RSS-канала возможен только после подписки.
Как подписчик, вы получите в своё распоряжение бесплатный веб-агрегатор новостей доступный с любого компьютера в котором сможете просматривать и группировать каналы на свой вкус. А, так же, указывать какие из каналов вы захотите читать на вебе, а какие получать по электронной почте.
Подписаться на другой RSS-канал, зная только его адрес или адрес сайта.
Код формы подписки на этот канал для вашего сайта:
Последние новости
EUR/USD. April 26th. Bulls continue to advance after the GDP report
2024-04-26 14:21
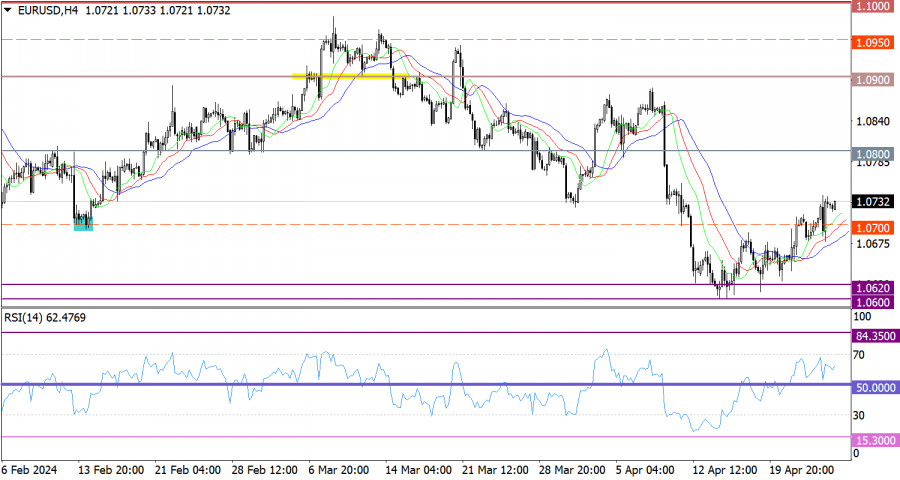
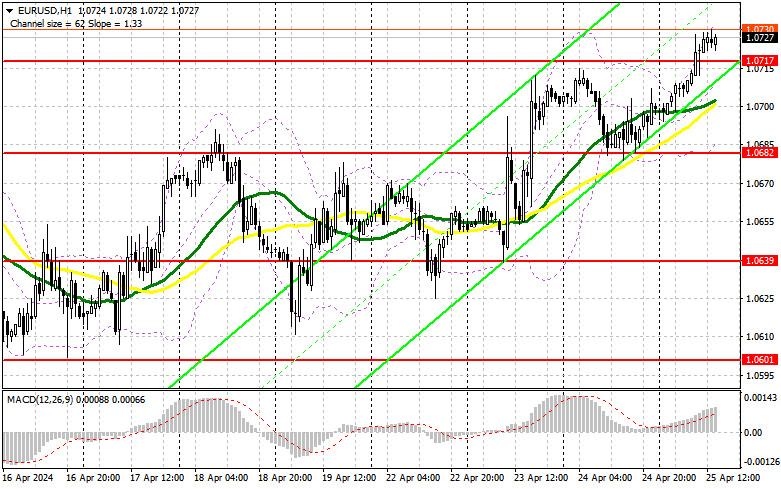
The EUR/USD pair on Thursday rebounded from the corrective level of 100.0%-1.0696 and resumed its upward movement towards the corrective level of 76.4%-1.0764. The ascending trend channel continues to characterize the current market sentiment as "bullish." Consolidation of quotes below the ascending corridor will change the market sentiment to "bearish" and may lead to a resumption of the pair's decline towards the level of 1.0619 and below.
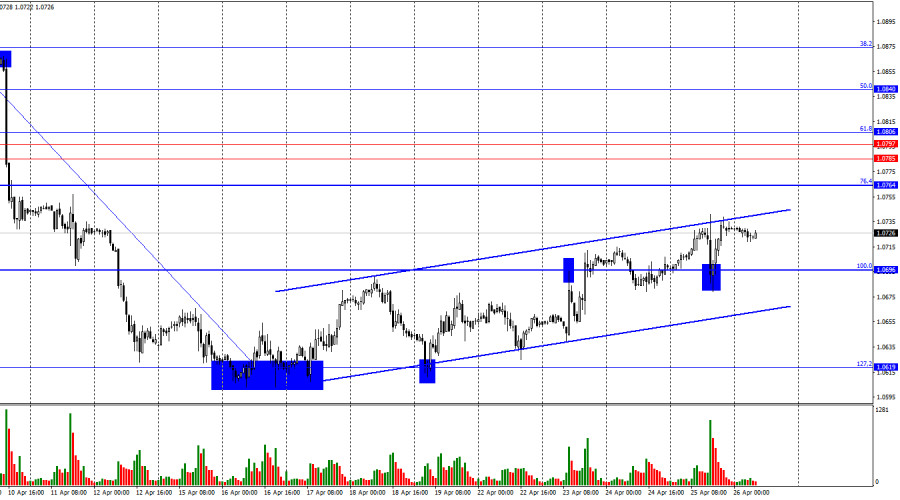
The wave situation remains unchanged. The last completed downward wave broke the low of the previous wave (from April 2nd), and the new upward wave is still too weak to break the last peak from April 9th. Thus, we are dealing with a "bearish" trend, and at the moment, there is no sign of its completion. For such a sign to appear, the new upward wave needs to break the peak of the previous wave (from April 9th). If the next downward wave fails to break the last low from April 16th, this will also be a sign of a trend change to "bullish." Until then, the bears will maintain their advantage.
The information background on Thursday was important and strong. Traders learned about the economic growth of the United States in the first quarter. It amounted to 1.6% quarter-on-quarter and 3.1% year-on-year. It is noteworthy that the quarterly GDP of the United States turned out to be significantly below traders' expectations, while the annual one was higher. Bears failed to benefit from this report, as the quarterly value is still slightly more important. The American economy continues to slow down for the second quarter in a row, and the pace of the slowdown is quite high. At this rate, by the end of the year, the US economy may show growth close to zero, as is currently happening in the UK and the EU. A reduction in the Federal Reserve rate will not happen anytime soon, so the US economy may continue to slow down.
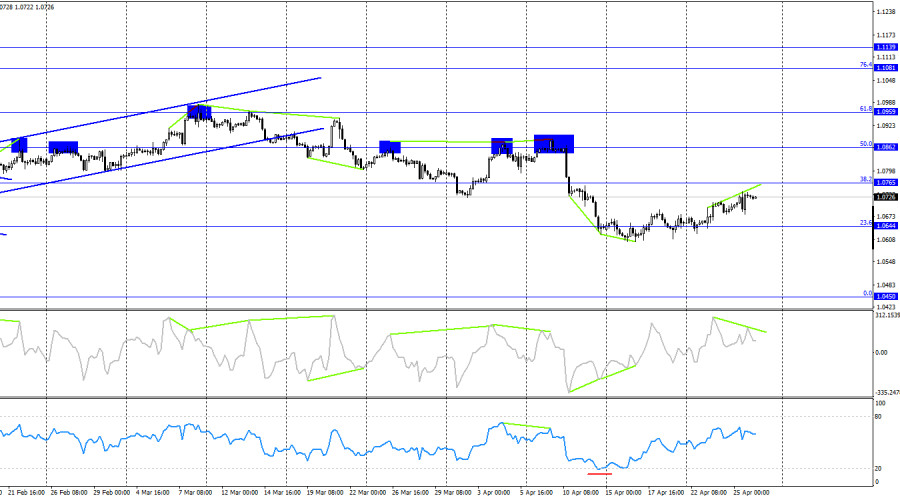
On the 4-hour chart, the pair fell to the corrective level of 23.6%-1.0644 and rebounded from it after forming two "bullish" divergences on the CCI indicator and the RSI indicator falling below 20. Thus, a reversal in favor of the euro occurred, and the upward movement began towards the corrective level of 38.2%-1.0765. A "bearish" divergence is looming on the CCI indicator, which could put an end to the euro's rise. Consolidation of the pair's exchange rate below the level of 1.0644 will allow expecting a resumption of the decline towards the next Fibonacci level of 0.0%-1.0450.
Commitments of Traders (COT) report:
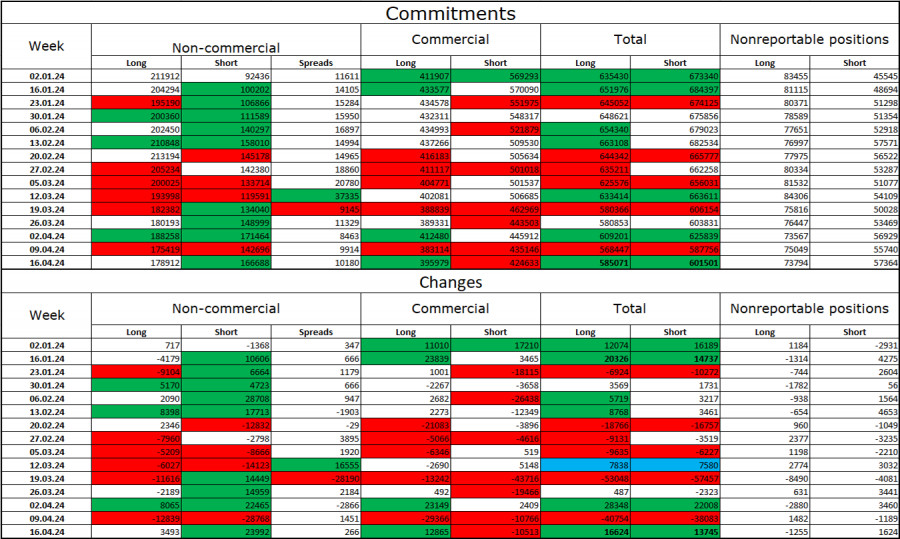
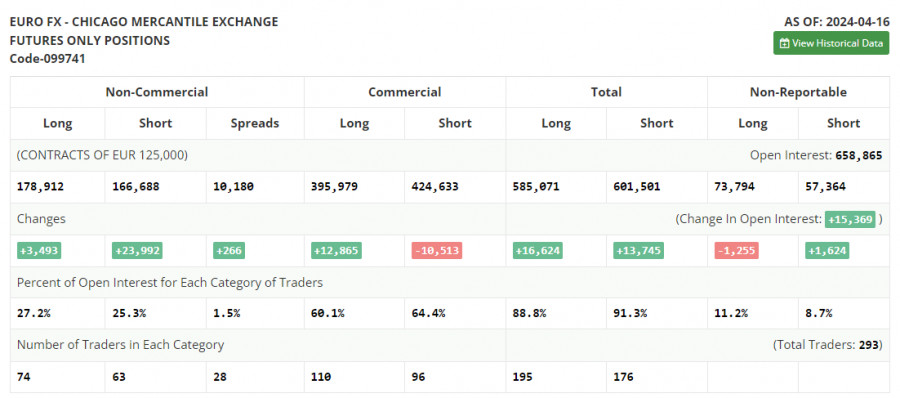
In the last reporting week, speculators opened 3493 long contracts and 23992 short contracts. The sentiment of the "Non-commercial" group remains "bullish" but continues to weaken rapidly. The total number of Long contracts held by speculators now stands at 179 thousand, while Short contracts amount to 167 thousand. The situation will continue to change in favor of bears. In the second column, we see that the number of Short positions has increased from 92 thousand to 167 thousand over the past 3 months. During the same period, the number of Long positions decreased from 211 thousand to 179 thousand. Bulls have dominated the market for too long, and now they need a strong information background to resume the "bullish" trend. However, the information background has been supporting bears only recently. The European currency could have lost many more positions in recent weeks.
News Calendar for the US and EU:
US - Core Personal Consumption Expenditure Price Index (12:30 UTC).
US - Personal Income and Spending Change (12:30 UTC).
US - University of Michigan Consumer Sentiment Index (14:00 UTC).
On April 26th, the economic events calendar contains three entries of approximately equal importance. The impact of the news background on traders' sentiment today may be of moderate strength, but only in the second half of the day.
Forecast for EUR/USD and trader advice:
Sales of the pair are possible today on consolidation below the ascending corridor on the hourly chart with a target at 1.0619. Or on a rebound from the upper channel line with a target at the lower line. Purchases of the euro were possible on a close (or rebound) above the level of 1.0696 on the hourly chart with a target at 1.0764, but bulls are currently weak, so the rise may end soon. Caution should be exercised with purchases.
The material has been provided by InstaForex Company - www.instaforex.com
Forecast for GBP/USD on April 26, 2024
2024-04-26 13:43
On the hourly chart, the GBP/USD pair on Thursday rose to the level of 1.2517, rebounded from it, then rebounded from the Fibonacci level of 50.0% (1.2464), and returned to the level of 1.2517. A new rebound from this level will again work in favor of the American currency and lead to some decline in the pair towards the level of 1.2464. Consolidation of quotes above the level of 1.2517 increases the probability of further growth towards the next Fibonacci level of 38.2% (1.2565).
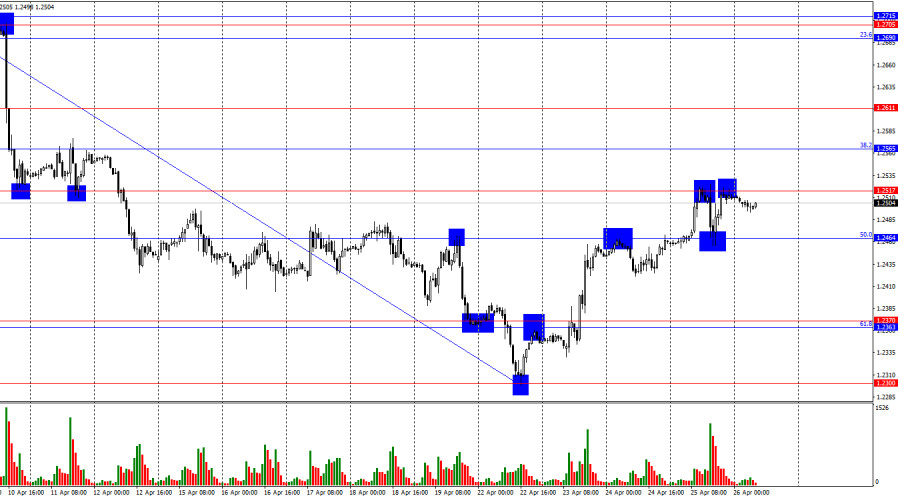
The wave situation remains unchanged. The last completed downward wave broke the low of the previous wave, and the new upward wave has yet to approach the last peak from April 9th. Thus, the trend for the GBP/USD pair remains "bearish," and there are no signs of its completion at the moment. The first sign of a transition to an uptrend could be a breakout of the peak from April 9th, but bulls need to overcome a distance of about 220 pips to the zone of 1.2705–1.2715. It is unlikely that a trend change to "bullish" should be expected in the coming days. A new downward wave, if weak and does not break the low from April 22nd, can also indicate a trend reversal.
On Thursday, the US GDP report greatly helped bullish traders maintain a short-term positive sentiment. Despite the fact that the British pound has been rising for four consecutive days, the previous wave was much larger, so the initiative remains with the bears. Not all reports from the US this week have been positive, with most contributing to the decline of the American currency. Today, there will be at least two interesting reports in America. The core personal consumption expenditure index and the University of Michigan consumer sentiment index. If these two reports at the end of the week turn out to be stronger than traders' expectations, the dollar may start forming a new upward wave. This will be a logical development of the situation.
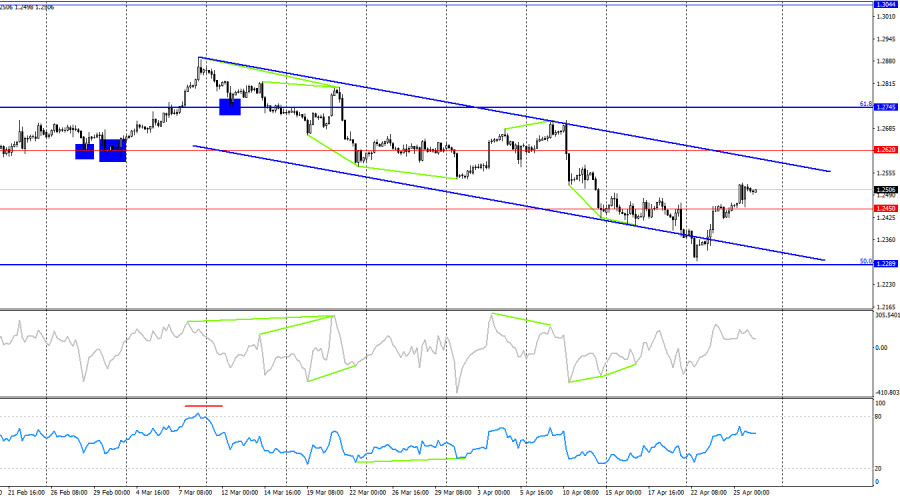
On the 4-hour chart, the pair consolidated above the level of 1.2450. Thus, the upward process may continue towards the next level of 1.2620, but most likely, it will end in the near future, and the pair will not exit the descending trend corridor. There are no emerging divergences observed today in any indicator. A rebound of the pair's exchange rate from the upper line of the corridor will work in favor of the American currency.
Commitments of Traders (COT) report:
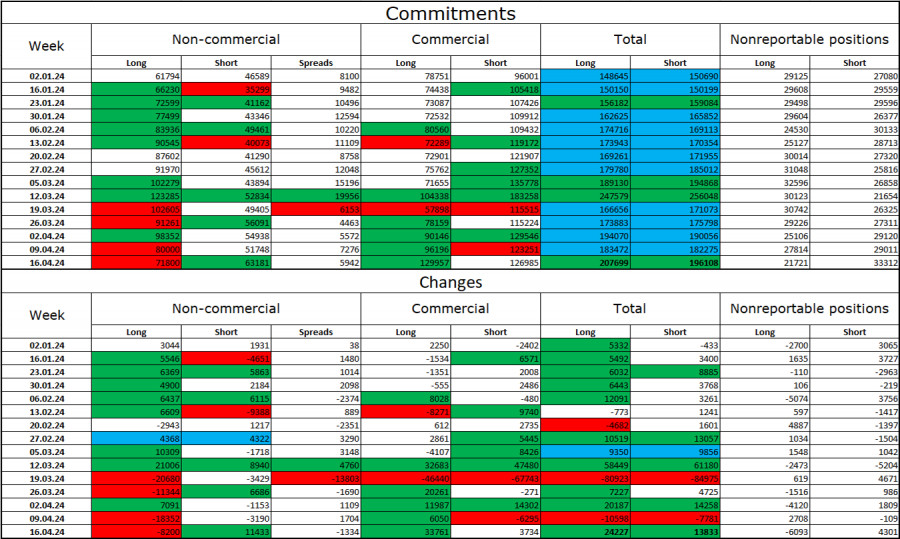
The sentiment of the "non-commercial" trader category for the last reporting week has become less "bullish." The number of long contracts held by speculators decreased by 8200 units, while the number of short contracts increased by 11433 units. The overall sentiment of large players remains "bullish" but has been weakening in recent weeks. The gap between the number of long and short contracts is almost nonexistent: 72 thousand versus 63 thousand.
There are prospects for a decline in the British pound. Over the past 3 months, the number of long positions has increased from 62 thousand to 72 thousand, while the number of short positions has increased from 47 thousand to 63 thousand. This explains the relatively weak decline of the British pound. Over time, bulls will start getting rid of buy positions or increasing sell positions, as all possible factors for buying the British pound have already been worked out. Bears have demonstrated their weakness and complete unwillingness to go on the offensive in recent months, but inflation reports in the US and UK may give them new strength.
News Calendar for the US and UK:
US - Core Personal Consumption Expenditure Price Index (12:30 UTC).
US - Personal Income and Spending Change (12:30 UTC).
US - University of Michigan Consumer Sentiment Index (14:00 UTC).
On Friday, the economic events calendar contains only three entries in the US. The impact of the news background on the market sentiment today may be of moderate strength.
Forecast for GBP/USD and trader advice:
Sales of the British pound are possible today on an hourly chart rebound from the level of 1.2517 with targets at 1.2464 and 1.2363-1.2370. Purchases of the pair were possible on consolidation above the level of 1.2464 with a target of 1.2517. This target has been reached. New purchases are possible on a rebound from the level of 1.2464 or a close above 1.2517 with a target of 1.2565.
The material has been provided by InstaForex Company - www.instaforex.com
Forex forecast 04/26/2024: EUR/USD, USD/JPY, Oil and Bitcoin from Sebastian Seliga
2024-04-26 13:39
We introduce you to the daily updated section of Forex analytics where you will find reviews from forex experts, up-to-date monitoring of financial information as well as online forecasts of exchange rates of the US dollar, euro, ruble, bitcoin, and other currencies for today, tomorrow and this trading week.
Useful links:
My other articles are available in this section: https://www.instaforex.com/analytics_authors?author=46
InstaForex course for beginners: https://www.instaforex.com/distance_training_program
Popular Analytics: https://www.instaforex.com/forex_analysis
Open trading account: https://www.instaforex.com/fast_open_new_account
Important:
The begginers in forex trading need to be very careful when making decisions about entering the market. Before the release of important reports, it is best to stay out of the market to avoid being caught in sharp market fluctuations due to increased volatility. If you decide to trade during the news release, then always place stop orders to minimize losses.
Without placing stop orders, you can very quickly lose your entire deposit, especially if you do not use money management and trade large volumes. For successful trading, you need to have a clear trading plan and stay focues and disciplined. Spontaneous trading decision based on the current market situation is an inherently losing strategy for a scalper or daytrader.
#instaforex #analysis #sebastianseliga
The material has been provided by InstaForex Company - www.instaforex.com
Video market update for April 26, 2024
2024-04-26 13:31
POtential for the further upside movement on the USD/JPYThe material has been provided by InstaForex Company - www.instaforex.com
USD/JPY: trading tips for beginners for European session on April 26
2024-04-26 10:47
Overview of trading and tips on USD/JPY
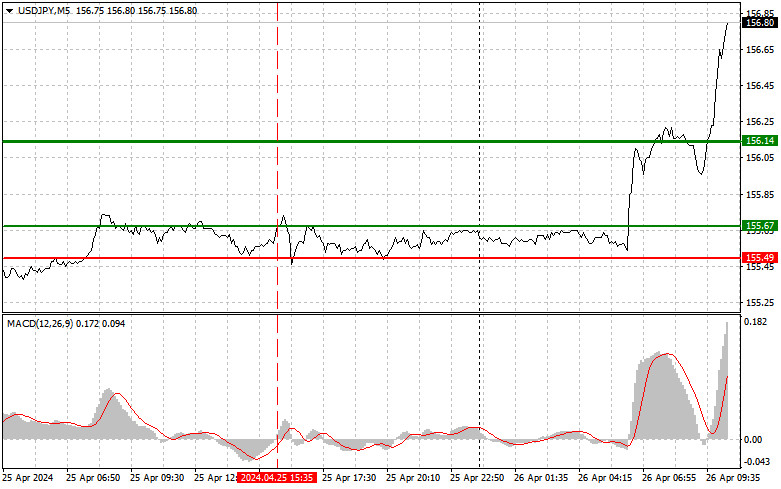
The price test of 155.67 at the beginning of the US session occurred at a time when the MACD indicator was just starting to move up from the zero mark, which confirmed the entry point to buy the dollar in continuation of the uptrend. However, the pair did not sharply rise, which led to profit-taking. Weak US data hindered the pair's upward potential. However, everything changed in today's Asian session after the Bank of Japan decided to leave interest rates unchanged. Hints that the BOJ is in no rush to raise rates, as the economy needs to adjust to recent policy changes, supported the dollar and the yen fell. Most likely, the trend will continue. Only very weak US data in the afternoon will be able to hinder the pair's upward potential. As for the intraday strategy, I will rely more on the implementation of scenarios No. 1 and No. 2.
Buy signals
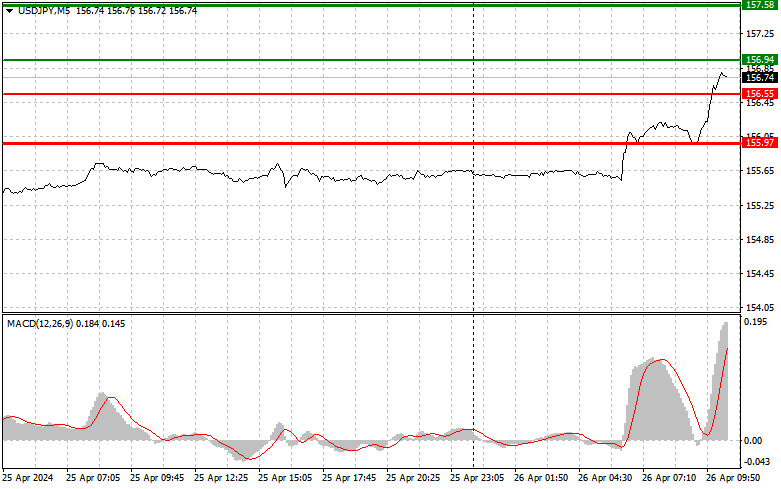
Scenario No. 1. I plan to buy USD/JPY today when the price reaches the entry point around 156.94 plotted by the green line on the chart, aiming for growth to 157.58 plotted by the thicker green line on the chart. In the area of 157.58, I'm going to exit long positions and open short ones in the opposite direction, expecting a movement of 30-35 pips in the opposite direction from that level. You can count on USD/JPY's growth today based on the trend after breaking through the daily high. Before buying, make sure that the MACD indicator is above the zero mark and is just starting to rise from it.
Scenario No. 2. I also plan to buy USD/JPY today in case of two consecutive tests of 156.55 at the time when the MACD indicator is in the oversold area. This will limit the downward potential of the pair and lead to an upward reversal of the market. We can expect growth to the opposite levels of 156.94 and 157.58.
Sell signals
Scenario No. 1. I plan to sell USD/JPY today only after testing the level of 156.55 plotted by the red line on the chart, which will lead to a rapid decline in the price. The key target for sellers will be 155.97, where I am going to exit short positions and also immediately open long ones in the opposite direction, expecting a movement of 20-25 pips in the opposite direction from that level. Pressure on USD/JPY may return after an unsuccessful breakout of the daily high and active actions by the central bank. Before selling, make sure that the MACD indicator is below the zero mark and is just starting to decline from it.
Scenario No. 2. I also plan to sell USD/JPY today in case of two consecutive tests of the price of 156.94 at the time when the MACD indicator is in the overbought area. This will limit the pair's upward potential and lead to a downwards market reversal. We can expect a decline to the opposite levels of 156.55 and 155.97.
What's on the chart:
The thin green line is the entry price at which you can buy the trading instrument.
The thick green line is the price where you can set Take-Profit (TP) or manually fix profits, as further growth above this level is unlikely.
The thin red line is the entry price at which you can sell the trading instrument.
The thick red line is the price where you can set Take-Profit (TP) or manually fix profits, as further decline below this level is unlikely.
MACD line: it is important to be guided by overbought and oversold areas when entering the market
Important: Novice traders in the cryptocurrency market need to be very cautious when making decisions to enter the market. It is best to stay out of the market before important fundamental reports are released to avoid getting caught in sharp price fluctuations. If you decide to trade during news releases, always place stop orders to minimize losses. Without setting stop orders, you can quickly lose your entire deposit, especially if you don't use money management and trade with large volumes.
Remember, for successful trading, it is necessary to have a clear trading plan, similar to the one I presented above. Spontaneously making trading decisions based on the current market situation is inherently a losing strategy for an intraday trader.
The material has been provided by InstaForex Company - www.instaforex.com
GBP/USD: trading tips for beginners for European session on April 26
2024-04-26 10:47
Overview of trading and tips on GBP/USD
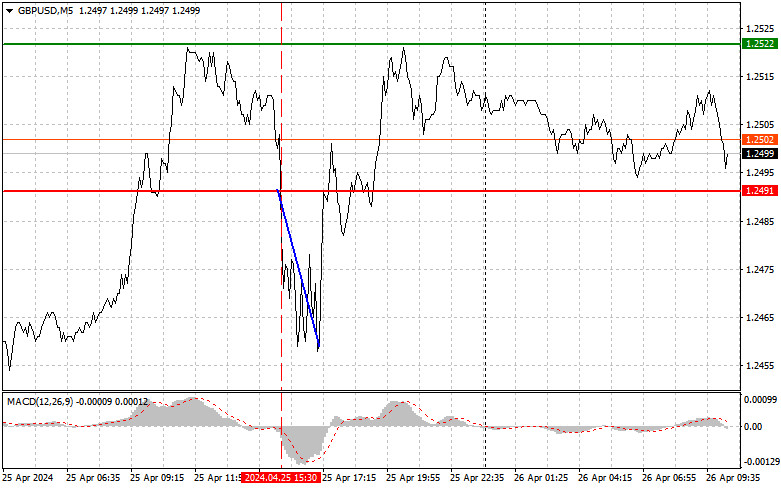
The price test of 1.2491 in the afternoon occurred at a time when the MACD indicator had sharply dropped from the zero mark. Nevertheless, I sold the pound because I expected a strong movement after the release of the US GDP report, which happened. As a result, the pair fell by more than 35 pips. Disappointing US data puts the Federal Reserve in a more difficult position than before. Both rising inflation and slowing US growth are far from what the central bank has been striving for in the past year. Obviously, the weaker the US indicators, the higher the demand for the pound. In the absence of UK data, we can expect the pair to rise in line with the uptrend. Things might change in the afternoon, as we wait for another round of strong US inflation-related data. We'll discuss the reports in the afternoon forecast. For now, I'll proceed with the progress of the new upward trend and buy on pullbacks. As for the intraday strategy, I will rely more on the implementation of scenarios No. 1 and No. 2.
Buy signals
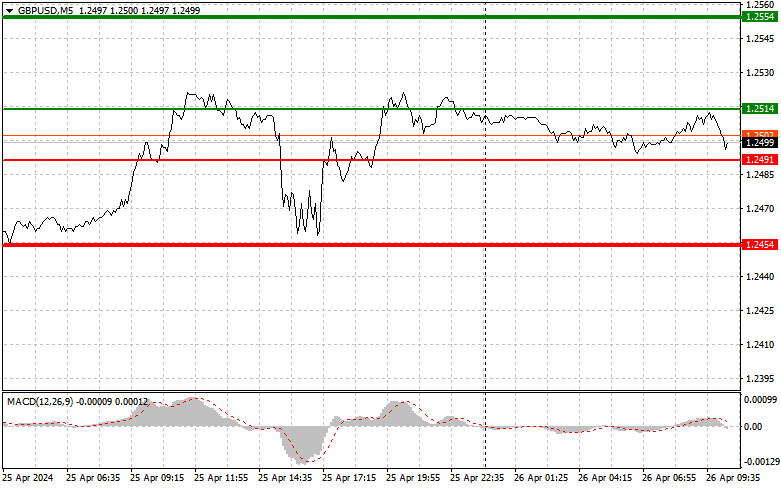
Scenario No. 1. I plan to buy the pound today when GBP/USD reaches the area around 1.2514 plotted by the green line on the chart, aiming for growth to 1.2554 plotted by the thicker green line on the chart. In the area of 1.2554, I'm going to close long positions and open short ones in the opposite direction (expecting a movement of 30-35 pips in the opposite direction from the level). You can count on the pound's growth today in line with the upward trend. Before buying, make sure that the MACD indicator is above the zero mark and is just starting to rise from it.
Scenario No. 2. I also plan to buy the pound today in case of two consecutive tests of the price of 1.2491 at the time when the MACD indicator is in the oversold area. This will limit the downward potential of the instrument and lead to an upward reversal of the market. We can expect growth to the opposite levels of 1.2514 and 1.2554.
Sell signals
Scenario No. 1. I plan to sell the pound today after testing the level of 1.2491 (the red line on the chart), which will lead to a rapid decline in GBP/USD. The key target for sellers will be 1.2454, where I am going to close short positions and also open long positions in the opposite direction (expecting a movement of 20-25 pips in the upward direction from that level). You can sell the pound after the pair fails to consolidate near the local high, counting on a small correction before the release of US data. Before selling, make sure that the MACD indicator is below the zero mark and is just starting to decline from it.
Scenario No. 2: I also plan to sell the pound today in case of two consecutive tests of 1.2514 at the time when the MACD indicator is in the overbought area. This will limit the pair's upward potential and lead to a downward reversal of the market. We can expect a decline to the opposite level of 1.2491 and 1.2454.
What's on the chart:
The thin green line is the entry price at which you can buy the trading instrument.
The thick green line is the price where you can set Take-Profit (TP) or manually fix profits, as further growth above this level is unlikely.
The thin red line is the entry price at which you can sell the trading instrument.
The thick red line is the price where you can set Take-Profit (TP) or manually fix profits, as further decline below this level is unlikely.
MACD line: it is important to be guided by overbought and oversold areas when entering the market
Important: Novice traders in the cryptocurrency market need to be very cautious when making decisions to enter the market. It is best to stay out of the market before important fundamental reports are released to avoid getting caught in sharp price fluctuations. If you decide to trade during news releases, always place stop orders to minimize losses. Without setting stop orders, you can quickly lose your entire deposit, especially if you don't use money management and trade with large volumes.
Remember, for successful trading, it is necessary to have a clear trading plan, similar to the one I presented above. Spontaneously making trading decisions based on the current market situation is inherently a losing strategy for an intraday trader.
The material has been provided by InstaForex Company - www.instaforex.com
EUR/USD: trading tips for beginners for European session on April 26
2024-04-26 10:47
Overview of trading and tips on EUR/USD
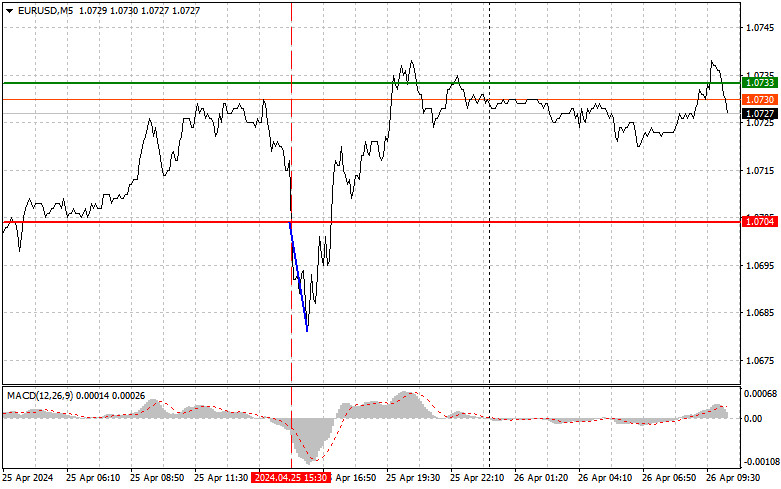
The price test of 1.0704 in the afternoon occurred at a time when the MACD indicator had sharply dropped from the zero mark. Despite this, I sold the euro because I expected a strong movement after the release of the US GDP report, which happened. As a result, the pair fell by more than 25 pips. Yesterday, Germany's leading consumer climate index and the ECB economic bulletin had no impact on the euro, but weak US data led to a surge in volatility and volume. Traders found it difficult to determine the direction, but the slower-than-expected economic growth prompted a dollar sell-off, and risk assets gained, which includes the euro. Today's eurozone reports on the M3 money supply and loans to companies and households are unlikely to significantly affect market direction. Therefore, I suggest focusing on the US reports. We'll discuss the reports in the afternoon forecast. As for the intraday strategy, I will rely more on the implementation of scenarios No. 1 and No. 2.
Buy signals
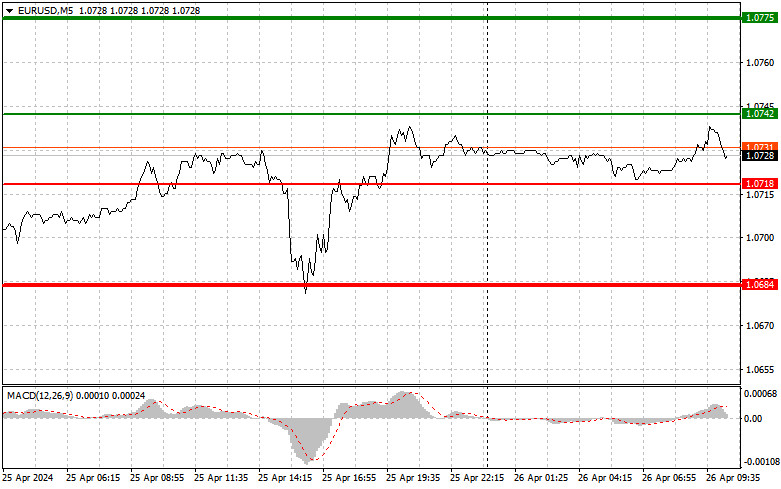
Scenario No 1. Today, you can buy the euro when the price reaches the area around 1.0742 plotted by the green line on the chart, aiming for growth to the level of 1.0775. At the level of 1.0775, I plan to exit the market and also sell the euro in the opposite direction, counting on a movement of 30-35 pips from the entry point. You can count on the euro to rise today only after good Eurozone data, in continuation of yesterday's trend. Before buying, make sure that the MACD indicator is above the zero mark and is just starting to rise from it.
Scenario No 2. I am also going to buy the euro today in case of two consecutive tests of the price of 1.0718 at the time when the MACD indicator is in the oversold area. This will limit the downward potential of the instrument and lead to an upward reversal of the market. We can expect growth to the opposite levels of 1.0742 and 1.0775.
Sell signals
Scenario No 1. I plan to sell the euro after EUR/USD reaches the level of 1.0718 plotted by the red line on the chart. The target will be the level of 1.0684, where I am going to exit the market and buy immediately in the opposite direction (expecting a movement of 20-25 pips in the upward direction from the level). Pressure on EUR/USD will increase if it fails to consolidate in the area of the daily high and after weak eurozone data. Before selling, make sure that the MACD indicator is below the zero mark and is just starting to decline from it.
Scenario No 2. I am also going to sell the euro today in case of two consecutive price tests of 1.0742 at the time when the MACD indicator is in the overbought area. This will limit the pair's upward potential and lead to a downward reversal of the market. We can expect a decline to the opposite level of 1.0718 and 1.0684.
What's on the chart:
The thin green line is the entry price at which you can buy the trading instrument.
The thick green line is the price where you can set Take-Profit (TP) or manually fix profits, as further growth above this level is unlikely.
The thin red line is the entry price at which you can sell the trading instrument.
The thick red line is the price where you can set Take-Profit (TP) or manually fix profits, as further decline below this level is unlikely.
MACD line: it is important to be guided by overbought and oversold areas when entering the market
Important: Novice traders in the cryptocurrency market need to be very cautious when making decisions to enter the market. It is best to stay out of the market before important fundamental reports are released to avoid getting caught in sharp price fluctuations. If you decide to trade during news releases, always place stop orders to minimize losses. Without setting stop orders, you can quickly lose your entire deposit, especially if you don't use money management and trade with large volumes.
Remember, for successful trading, it is necessary to have a clear trading plan, similar to the one I presented above. Spontaneously making trading decisions based on the current market situation is inherently a losing strategy for an intraday trader.
The material has been provided by InstaForex Company - www.instaforex.com
Hot forecast for EUR//USD on April 26, 2024
2024-04-26 09:55
The EUR/USD pair has settled above the level of 1.0700, which is a positive sign that suggests that the volume of long positions will rise.
On the four-hour chart, the RSI technical indicator is hovering in the upper area of 50/70, which points to the growth in buying volumes.
On the same chart, the Alligator's MAs are headed upwards, which corresponds to the bullish cycle.
Outlook
In this situation, keeping the price above the level of 1.0700 by the end of the trading week may gradually push the euro towards the levels of 1.0800-1.0900. However, if the bullish momentum stops and the quote falls below the level of 1.0700, sellers will have a second chance to update the local low.
Complex indicator analysis indicates an uptrend phase in the short- and long-term timeframes.
The material has been provided by InstaForex Company - www.instaforex.com
Key events on April 26: fundamental analysis for beginners
2024-04-26 07:38
Analysis of macroeconomic reports:

There are quite a few macroeconomic events scheduled for Friday, but all of them are in the US. There won't be any significant reports in the European Union, the United Kingdom, or Germany. Therefore, currency pairs may exhibit sluggish movements during the European trading session. The US will release reports on Personal Income and Spending of American consumers, the PCE index, and the University of Michigan Consumer Sentiment Index. Personal Income and Spending reports aren't exactly significant. Many experts consider the PCE index to be the "Federal Reserve's inflation gauge of choice", but it usually has a weak impact on market sentiment. The Consumer Sentiment Index may provoke a reaction, but only in case of a significant deviation of the actual value from the forecast.
Analysis of fundamental events:
From Friday's fundamental events, only a speech by Luis de Guindos from the European Central Bank stands out. However, as we have already mentioned, the market isn't raising questions about the ECB's monetary policy, so we don't expect the ECB vice president to provide the market with anything new or significant. Both pairs continue their bullish correction, and that's the most important thing at the moment. The downtrend is not yet over. A series of weak reports from the US should not stop the dollar's rise.
General conclusion:
Today, novice traders should pay attention to the PCE and University of Michigan reports. Most likely, the market will show a weak reaction to these reports. Both currency pairs may go through low volatility during the European session due to the quiet news background. In regards to the euro, the technical picture is clear at the moment, as the ascending channel clearly indicates the range and direction in which the pair can be traded. With the pound, things are more complicated, but the corrective phase is present here as well.
Basic rules of a trading system:
1) Signal strength is determined by the time taken for its formation (either a bounce or level breach). A shorter formation time indicates a stronger signal.
2) If two or more trades around a certain level are initiated based on false signals, subsequent signals from that level should be disregarded.
3) In a flat market, any currency pair can produce multiple false signals or none at all. In any case, the flat trend is not the best condition for trading.
4) Trading activities are confined between the onset of the European session and mid-way through the U.S. session, after which all open trades should be manually closed.
5) On the 30-minute timeframe, trades based on MACD signals are only advisable amidst substantial volatility and an established trend, confirmed either by a trendline or trend channel.
6) If two levels lie closely together (ranging from 5 to 15 pips apart), they should be considered as a support or resistance zone.
How to read charts:
Support and Resistance price levels can serve as targets when buying or selling. You can place Take Profit levels near them.
Red lines represent channels or trend lines, depicting the current market trend and indicating the preferable trading direction.
The MACD(14,22,3) indicator, encompassing both the histogram and signal line, acts as an auxiliary tool and can also be used as a signal source.
Significant speeches and reports (always noted in the news calendar) can profoundly influence the price dynamics. Hence, trading during their release calls for heightened caution. It may be reasonable to exit the market to prevent abrupt price reversals against the prevailing trend.
Beginners should always remember that not every trade will yield profit. Establishing a clear strategy coupled with sound money management is the cornerstone of sustained trading success.
The material has been provided by InstaForex Company - www.instaforex.com
Trading plan for GBP/USD on April 26. Simple tips for beginners
2024-04-26 07:32
Analyzing Thursday's trades:
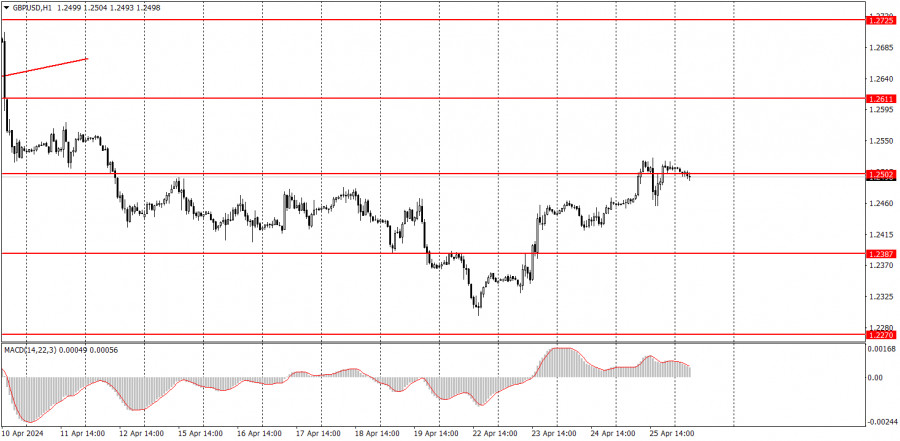
GBP/USD on 1H chart

The GBP/USD pair continued to correct higher on Thursday. The pair's movement was influenced by the US GDP report, as there were simply no other events or reports during the day. The British pound only managed to rise to the level of 1.2502 because the quarterly GDP figure turned out to be one and a half times lower than forecasted. The American economy is slowing down, and this is bad news. The fact that US economic growth cooled will lead to a slowdown in inflation in the future. And the faster inflation slows down, the sooner the Federal Reserve will move to ease its monetary policy, which is bad for the dollar. We still believe that the market has not priced in half of the factors causing the GBP/USD pair's decline, so we expect it to fall further. For now, the downtrend remains intact.
GBP/USD on 5M chart
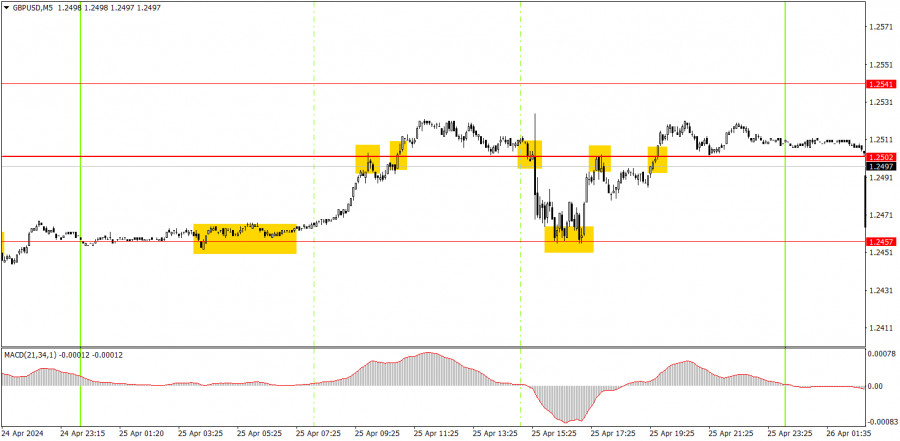
Several trading signals were generated on the 5-minute timeframe. In the morning, long positions could be opened near the level of 1.2457. Unfortunately, a false sell signal was formed around the level of 1.2502, followed by a false buy signal, which offset the profit from the first trade. Therefore, it was necessary to trade signals that were not formed around the level of 1.2502. There was one such signal – a rebound at the beginning of the US session from the level of 1.2457. Like the first signal, this turned out to be the right signal and beginners could earn another 25 pips. Overall, the day was chaotic but still profitable.
Trading tips on Friday:
On the hourly chart, the GBP/USD pair has excellent prospects for forming a downward trend, but is currently going through a correction. After surpassing the level of 1.2502, traders may expect a significant decline from the pound. The fundamental and macroeconomic backdrop continues to support the dollar much more than the British pound. Therefore, we only expect downward movement from the pair.
Today, novice traders can look for new sell signals around the level of 1.2502. The market is not in a rush to sell the pair, but the pound is gradually depreciating in the medium term, which is a good sign. The pair may continue to correct higher if today's US data turns out to be weaker than expected.
The key levels on the 5M chart are 1.2270, 1.2310, 1.2372-1.2387, 1.2457, 1.2502, 1.2544, 1.2605-1.2611, 1.2648, 1.2691, 1.2725, 1.2787-1.2791. There are no significant events planned in the UK for today, while the US will release Personal Income and Spending, the University of Michigan Consumer Sentiment Index, and the Personal Consumption Expenditures Price Index (PCE).
Basic trading rules:
1) Signal strength is determined by the time taken for its formation (either a bounce or level breach). A shorter formation time indicates a stronger signal.
2) If two or more trades around a certain level are initiated based on false signals, subsequent signals from that level should be disregarded.
3) In a flat market, any currency pair can produce multiple false signals or none at all. In any case, the flat trend is not the best condition for trading.
4) Trading activities are confined between the onset of the European session and mid-way through the U.S. session, after which all open trades should be manually closed.
5) On the 30-minute timeframe, trades based on MACD signals are only advisable amidst substantial volatility and an established trend, confirmed either by a trendline or trend channel.
6) If two levels lie closely together (ranging from 5 to 15 pips apart), they should be considered as a support or resistance zone.
How to read charts:
Support and Resistance price levels can serve as targets when buying or selling. You can place Take Profit levels near them.
Red lines represent channels or trend lines, depicting the current market trend and indicating the preferable trading direction.
The MACD(14,22,3) indicator, encompassing both the histogram and signal line, acts as an auxiliary tool and can also be used as a signal source.
Significant speeches and reports (always noted in the news calendar) can profoundly influence the price dynamics. Hence, trading during their release calls for heightened caution. It may be reasonable to exit the market to prevent abrupt price reversals against the prevailing trend.
Beginners should always remember that not every trade will yield profit. Establishing a clear strategy coupled with sound money management is the cornerstone of sustained trading success.
The material has been provided by InstaForex Company - www.instaforex.com
Trading plan for EUR/USD on April 26. Simple tips for beginners
2024-04-26 07:31
Analyzing Thursday's trades:
EUR/USD on 1H chart
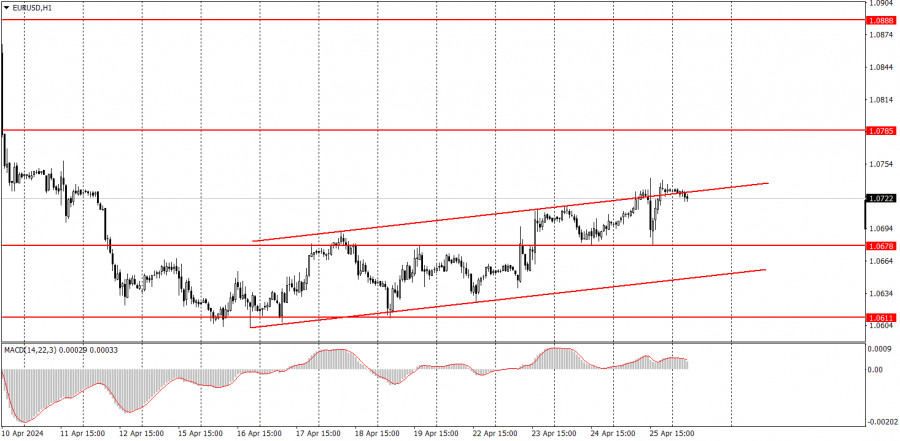
EUR/USD continued to trade within an ascending channel on Thursday. The pair changed direction several times. The US GDP report was partly responsible for this, which turned out to be significant and also highly contradictory. As a result, the market initially bought the pair, then panicked and sold it, then bought it again. The US economy grew by just 1.6% in the first quarter, significantly below forecasts. However, on an annual basis, the economy grew by 3.1%, exceeding market expectations. This is why the market initially bought the dollar and then sold it. It simply couldn't determine whether the report was positive or negative. We also find it difficult to answer this question. We believe that the main point is that the pair is correcting higher, and the dollar can easily rise once this phase ends.
EUR/USD on 5M chart
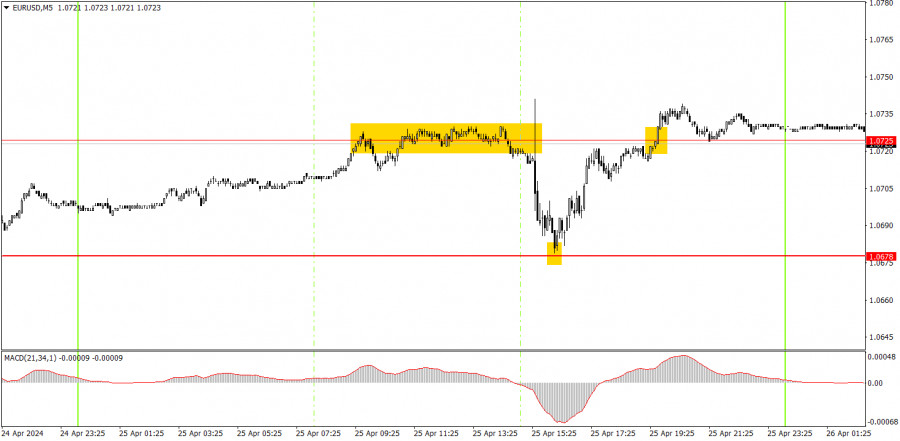
Several trading signals were generated on the 5-minute timeframe. Throughout the European session, the pair couldn't decide where to move from the level of 1.0725. Eventually, there was a rebound from this level and the price dropped to the target of 1.0678. This was the first signal to execute, which resulted in a profit of about 25 pips. The rebound from the level of 1.0678 was to be executed using a long position, and by evening, the price returned to the level of 1.0725, so beginners could earn another 30 pips of profit.
Trading tips on Friday:
On the hourly chart, the downtrend persists, but the EUR/USD pair is currently correcting higher. We believe that the euro should fall further, as it is still too high, and in general, the trend is headed downwards. However, at the moment, the market is likely taking a break before it starts a new downward movement.
Today, the pair may fall as it is currently near the upper boundary of the channel. Yesterday, the US GDP report prevented the decline, and today, the Personal Consumption Expenditures Price Index and the Consumer Sentiment Index in the US may hinder it. Nevertheless, we do not expect a strong rise.
The key levels on the 5M chart are 1.0483, 1.0526, 1.0568, 1.0611, 1.0678, 1.0725, 1.0785-1.0797, 1.0838-1.0856, 1.0888-1.0896, 1.0940, 1.0971-1.0981. There are no significant events planned in the European Union, while the US will release reports on Personal Income and Outlays, Consumer Sentiment Index, and Personal Consumption Expenditures Price Index. Together, these indices may influence market sentiment.
Basic trading rules:
1) Signal strength is determined by the time taken for its formation (either a bounce or level breach). A shorter formation time indicates a stronger signal.
2) If two or more trades around a certain level are initiated based on false signals, subsequent signals from that level should be disregarded.
3) In a flat market, any currency pair can produce multiple false signals or none at all. In any case, the flat trend is not the best condition for trading.
4) Trading activities are confined between the onset of the European session and mid-way through the U.S. session, after which all open trades should be manually closed.
5) On the 30-minute timeframe, trades based on MACD signals are only advisable amidst substantial volatility and an established trend, confirmed either by a trendline or trend channel.
6) If two levels lie closely together (ranging from 5 to 15 pips apart), they should be considered as a support or resistance zone.
How to read charts:
Support and Resistance price levels can serve as targets when buying or selling. You can place Take Profit levels near them.
Red lines represent channels or trend lines, depicting the current market trend and indicating the preferable trading direction.
The MACD(14,22,3) indicator, encompassing both the histogram and signal line, acts as an auxiliary tool and can also be used as a signal source.
Significant speeches and reports (always noted in the news calendar) can profoundly influence the price dynamics. Hence, trading during their release calls for heightened caution. It may be reasonable to exit the market to prevent abrupt price reversals against the prevailing trend.
Beginning traders should always remember that not every trade will yield profit. Establishing a clear strategy coupled with sound money management is the cornerstone of sustained trading success.
The material has been provided by InstaForex Company - www.instaforex.com
Trading Signals for USD/JPY for April 26-29, 2024: sell below 155.62 (21 SMA - overbought)
2024-04-26 06:28
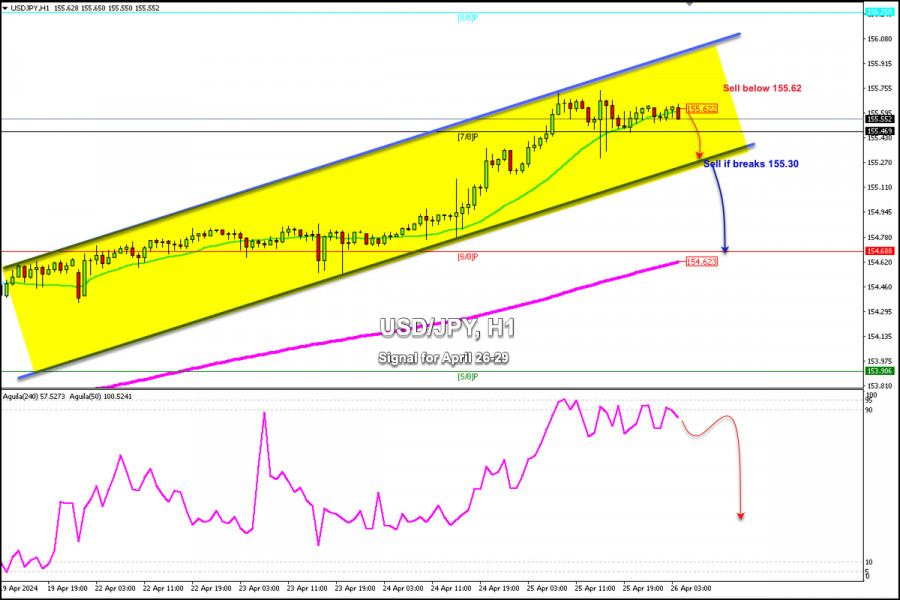
USD/JPY is trading around 155.62, above 7/8 Murray, and within the bullish channel forming since April 15. In the H1 chart, we can see that the Japanese Yen is strongly overbought and it is likely that a technical correction will occur in the next few hours and USD/JPY could reach the bottom of this channel around 155.18.
A sharp break of this uptrend channel and a consolidation below 155.60 could change the course of the Yen. USD/JPY could reverse downwards.
A technical correction could be confirmed if USD/JPY falls below the psychological level of 155.00 and could reach the 200 EMA located at 154.62 and the 5/8 Murray at 153.90.
Given that the Japanese Yen has strong resistance at 156.25 (8/8 Murray) as long as it trades above 155.40, USD/JPY could continue its rise and hit this target. On the contrary, the trend would change below 155.20.
The eagle indicator is giving an overbought signal, so a technical correction is imminent in the coming days. Thus, we can sell below 155.62 (21 SMA).
The material has been provided by InstaForex Company - www.instaforex.com
Technical Analysis of Intraday Price Movement of Polkadot Cryptocurrency, Friday April 26 2024.
2024-04-26 06:17
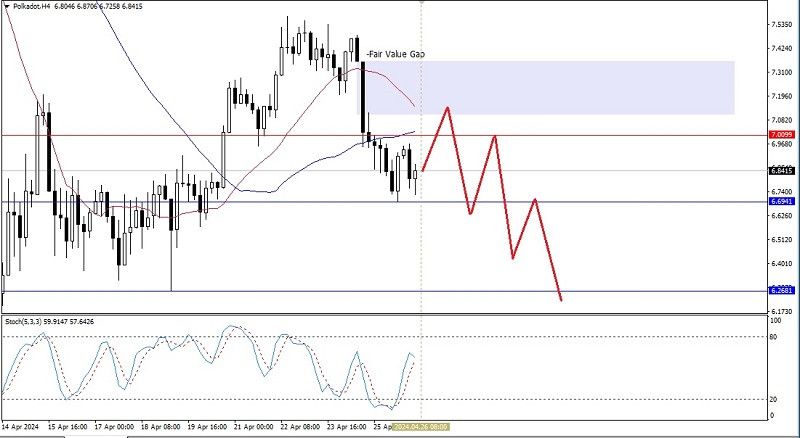
From what we seen on the 4 hour chart, Polkadot cryptocurrency seems pushed by the seller to break below the level 6,6941 although there is a potential of strengthening correction to test the Bearish Fair Value Gap area (Pink) but as long as does not break above the level 7,3574, then Polkadot still has the potential to continue it's weakness up to the level 6,2681.
(Disclaimer)
The material has been provided by InstaForex Company - www.instaforex.com
Technical Analysis of Intraday Price Movement of Cardano Cryptocurrency, Friday April 26 2024.
2024-04-26 06:17
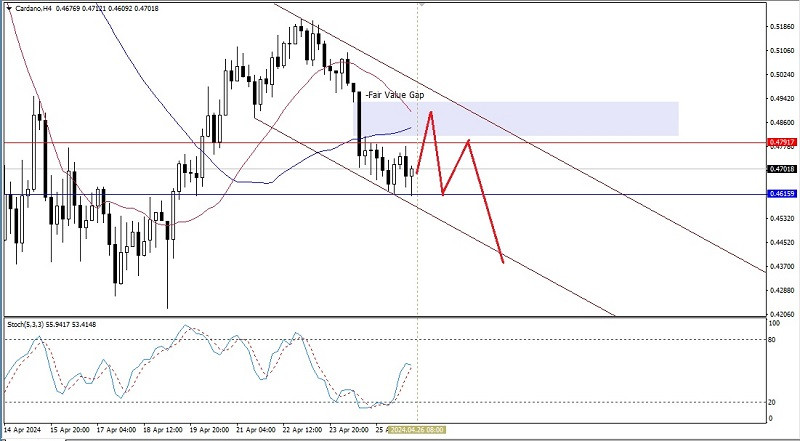
On the 4 hour chart of Cardano cryptocurrency seems there is a price movement which moves inside the downward channel where it means the Seller is conquering the condition of this cryptocurrency. However, there is still a chance to corrected to its strength above up to the level of Bearish Fair Value Gap (Pink). But as long as the strengthening correction does not break above the level 0,49650, then Cardano still has the potential to continue its weakness until the level 0,46159 as the main target and level 0,43963 as the next target to be aimed.
(Disclaimer)
The material has been provided by InstaForex Company - www.instaforex.com
Forecast for EUR/USD on April 26, 2024
2024-04-26 06:01
EUR/USD
Yesterday, it was difficult for the euro to close the day with a white candle, having fallen under the pressure of high volatility of the stock market. The pair has reached the target level of 1.0724, and the next target is 1.0757.
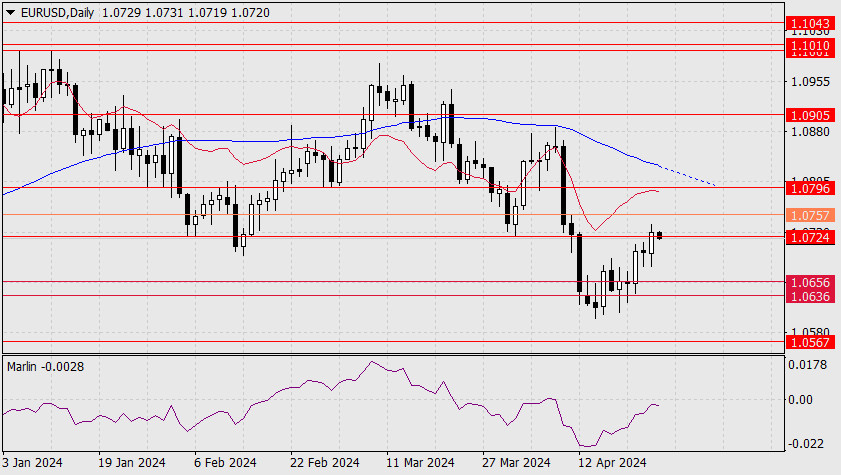
The current position of the Marlin oscillator, which is becoming more flat every day, indicates a low probability that the price will climb above 1.0757, just as Marlin itself is not averse to a downward reversal from the zero line. A sign of such a reversal will be the price consolidating below the level of 1.0724. We are waiting for the price to trade in the 1.0636/56 range.
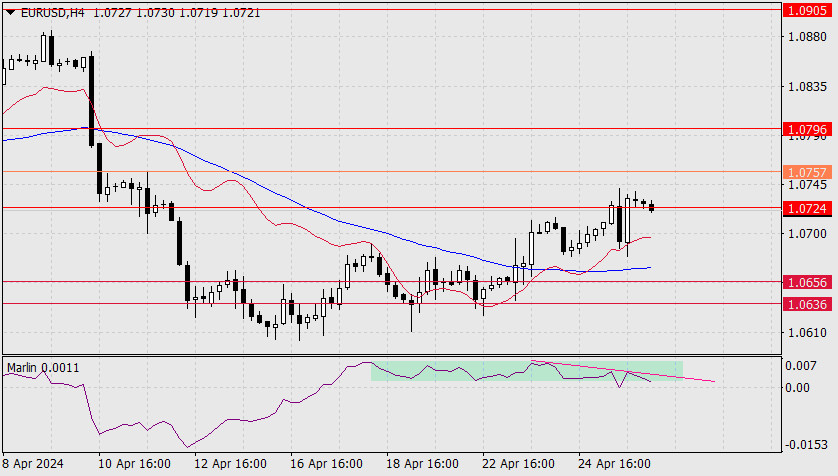
On the 4-hour chart, the signal line of the Marlin oscillator has already tried to move out of the consolidation range by moving downward on Thursday. At the same time, a divergence with the price was formed. These circumstances reduce the chance of even working off the nearest resistance at 1.0757. The choice will become clear on Monday morning.
The material has been provided by InstaForex Company - www.instaforex.com
Forecast for GBP/USD on April 26, 2024
2024-04-26 05:59
GBP/USD
Yesterday the pound closed the day up 49 pips, the upper shadow reached the target level of 1.2525 on the Fibonacci 38.2% retracement. The Marlin oscillator moved downward without reaching the border of the uptrend territory.
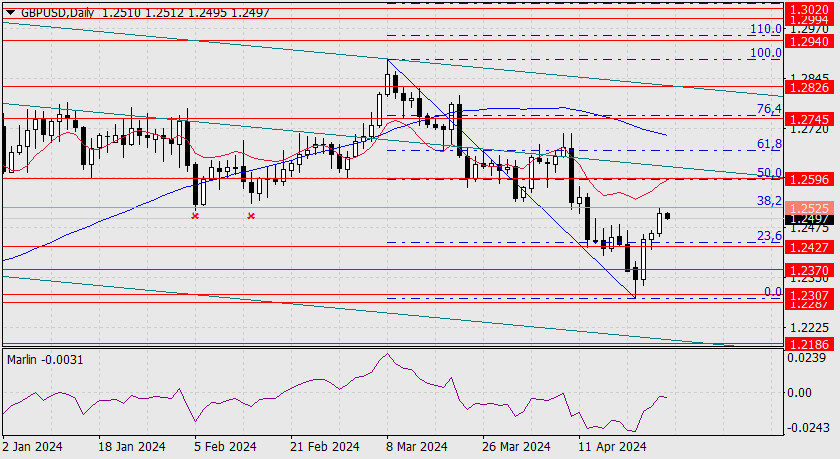
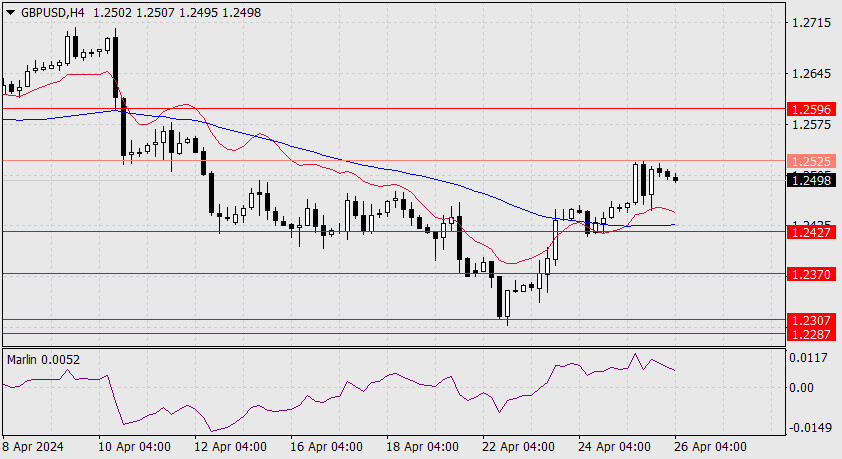
The correction has most likely ended. Now the price is facing the target of 1.2186 and ahead of it are the levels: 1.2427, 1.2370, 1.2287-1.2307. On the 4-hour chart, the Marlin oscillator is not turning around as quickly as expected, therefore, prices are likely to experience a slight delay.
There is a reason for such a delay and balance of forces. The level of 1.2427 is reinforced by the MACD indicator line and Fibonacci level of 23.6% on the daily timeframe. Overcoming this support will be a signal for the beginning of a decline in the medium-term.
The material has been provided by InstaForex Company - www.instaforex.com
Forecast for AUD/USD on April 26, 2024
2024-04-26 05:58
AUD/USD
The Australian dollar, along with the general market, rose yesterday. The upper shadow tested the daily balance indicator line. The Marlin oscillator entered positive territory this morning. The price is aiming for the intersection point of the balance line and the MACD line around the 0.6556 mark (coinciding with the April 11th peak).
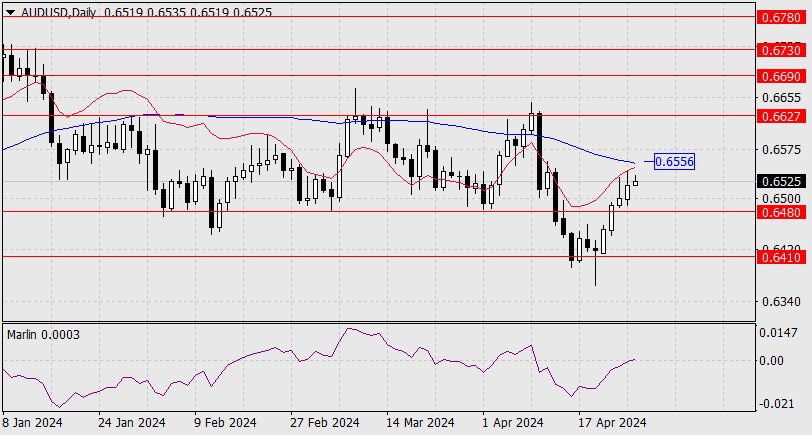
However, staying above the MACD line does not suggest further growth towards 0.6627, as was the case on April 9th. A return below 0.6480 would indicate a decline towards 0.6410. In the near future, the Australian dollar may drop to the target support of 0.6273 (October 2023 low).
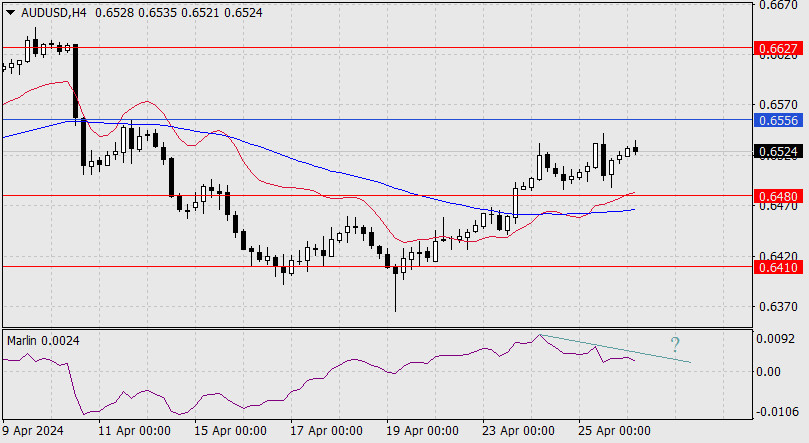
On the 4-hour chart, the price continues to rise under pressure from the forming divergence with the Marlin oscillator. The level of 0.6556 could work out. Next, the price may form a consolidation range before falling below 0.6480. We expect the Australian dollar to move sideways and the situation to resolve next week.
The material has been provided by InstaForex Company - www.instaforex.com
The ECB also has reasons to worry
2024-04-26 01:59

Demand for the euro has increased over the past few days, but I still believe we are dealing with a corrective wave within the larger Wave 3 or C. If this assumption is correct, the quotes will eventually decline under any circumstances, regardless of any news background. The market used the US GDP report to increase demand for the US currency. This is because the current corrective wave has taken on a convincing appearance, suggesting that the downtrend will resume.
The main reason for the euro's decline can be considered the looming easing of monetary policy in the Eurozone. The European Central Bank is about 80% certain of the timing of the first round of policy easing. This is likely to happen in June. Although market participants are also expecting the first rate cut in June, there are still certain circumstances that could prompt the central bank to postpone the first round to next month.
One of the ECB's policymakers, Isabel Schnabel, said that the services sector is a concern for the central bank. "We may face problems because of this sector. The more concerning part is productivity growth," she said. "We've had negative productivity growth now over several quarters."
I would also like to remind you that some of Schnabel's colleagues are urging the market not to rush with expectations regarding the easing of monetary policy. They believe that the current baseline scenario is one round of easing over two meetings. However, after the first round, the ECB intends to closely analyze incoming economic data. If the slowdown in inflation abates, the pauses between easing rounds may be longer than one meeting. Currently, the market expects three rounds of interest rate cuts in 2024. This is more than the expectations for rate cuts by the Federal Reserve.
I believe that the current news background still allows us to expect the formation of a downward Wave 3 or C, which is not yet clearly completed. The recent upward wave may have completed its formation already. Therefore, I expect the market to start increasing demand for the dollar again.
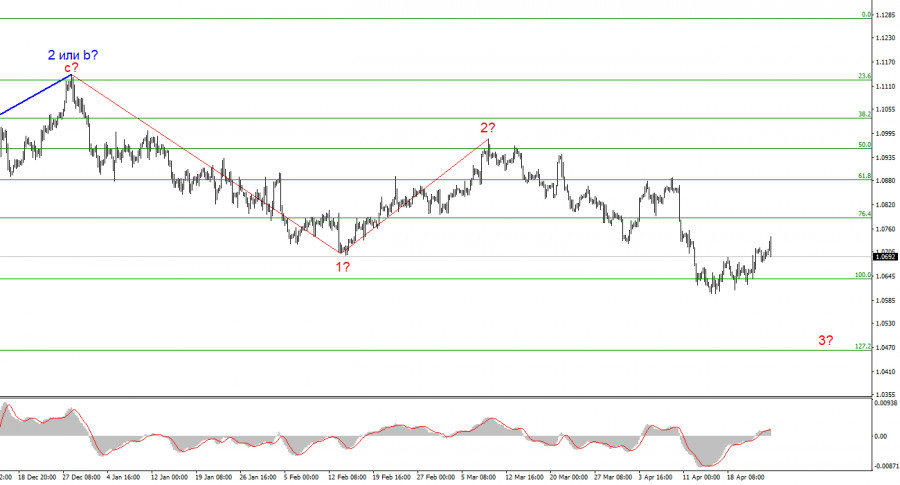
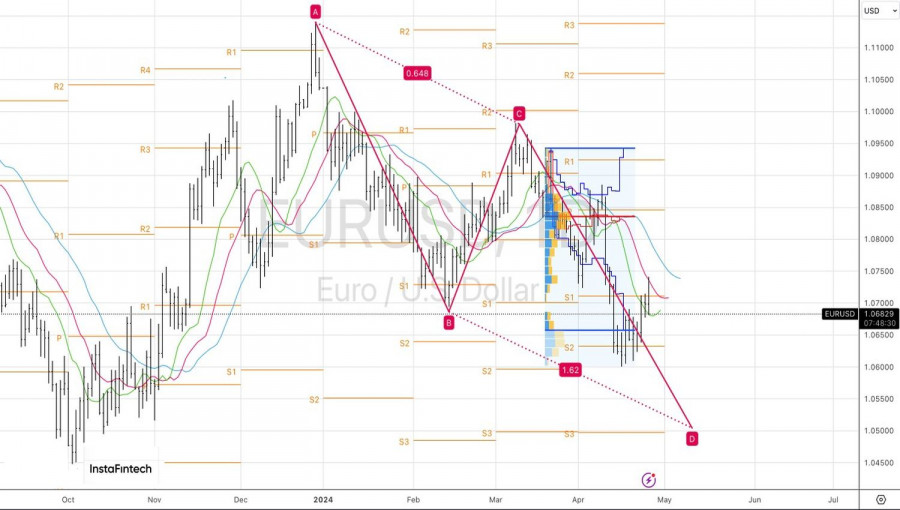
Wave analysis for EUR/USD:
Based on the conducted analysis of EUR/USD, I conclude that a bearish wave set is being formed. Waves 2 or b and 2 in 3 or c are complete, so in the near future, I expect an impulsive downward wave 3 in 3 or c to form with a significant decline in the instrument. I am considering short positions with targets near the 1.0463 mark, as the news background works in the dollar's favor. The sell signal we need near 1.0880 was formed (an attempt at a breakthrough failed).
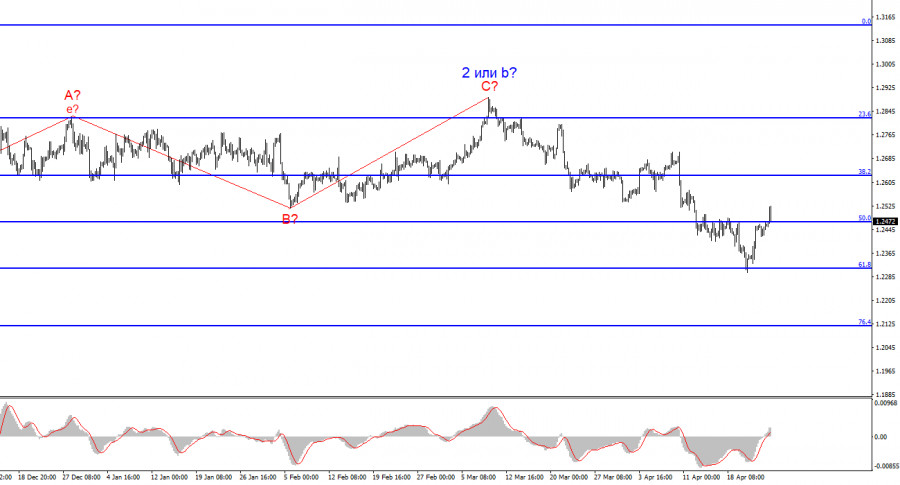
Wave analysis for GBP/USD:
The wave pattern of the GBP/USD instrument suggests a decline. I am considering selling the instrument with targets below the 1.2039 level, because I believe that wave 3 or c has started to form. A successful attempt to break 1.2472, which corresponds to 50.0% Fibonacci, indicates that the market is ready to build a descending wave.
Key principles of my analysis:
Wave structures should be simple and understandable. Complex structures are difficult to work with, and they often bring changes.
If you are not confident about the market's movement, it would be better not to enter it.
We cannot guarantee the direction of movement. Don't forget about Stop Loss orders.
Wave analysis can be combined with other types of analysis and trading strategies.
The material has been provided by InstaForex Company - www.instaforex.com
The dollar: there would have been no happiness, but misfortune helped
2024-04-26 01:57
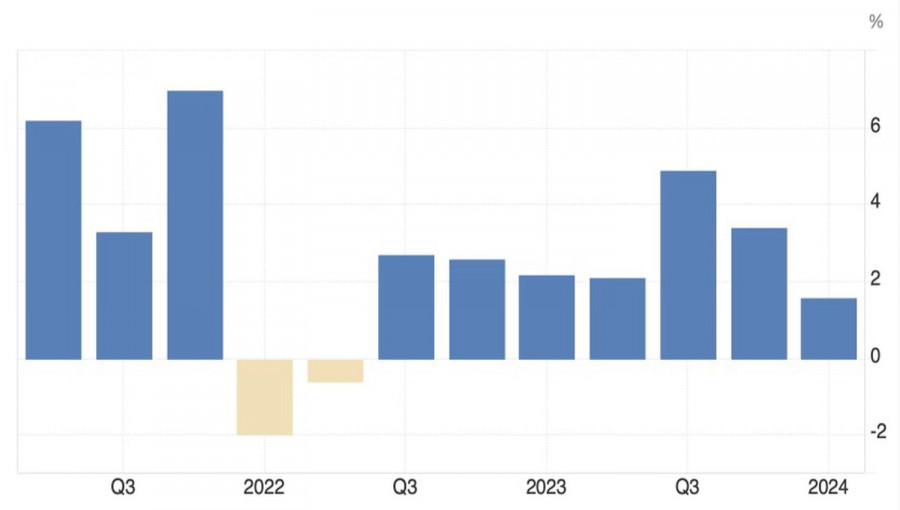
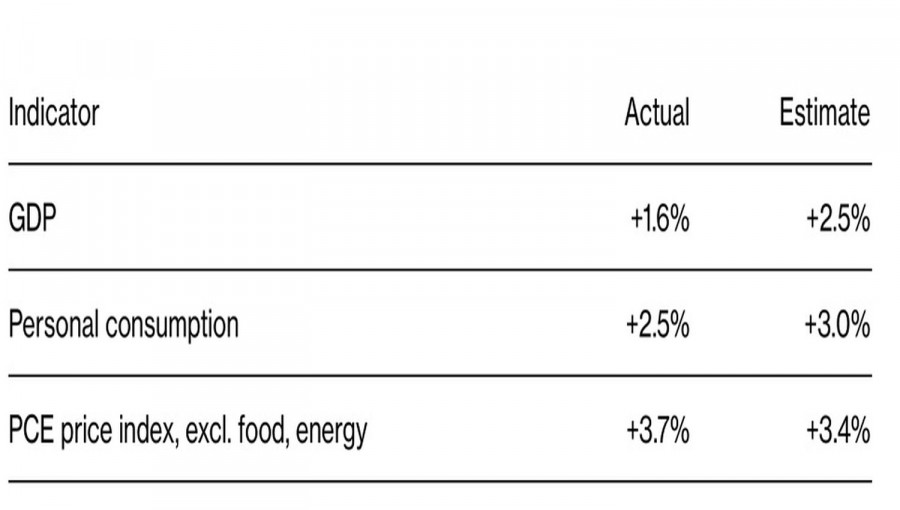
"Buy the rumor, sell the fact." US economic growth fell short of expectations, yet investors were so convinced of its slowdown that they were selling the US dollar from the beginning of the week until April 26. As soon as it became known that GDP expanded by 1.6%, rather than the anticipated 2.5% as forecasted by Bloomberg experts, it was time to take profit. As a result, EUR/USD failed to stay above the 1.07 mark.
The US economy grew at its slowest pace since the start of the Federal Reserve's tightening cycle in 2022, which had initially spooked American consumers. This time around, they became the main driving force behind gross domestic product expansion. Personal spending in the first quarter increased by 2.5%, while PCE jumped to 3.7%, exceeding expectations of +3.4%. In my opinion, it was the inflation dynamics alongside confirmed unemployment benefit claims that spooked EUR/USD bulls.
US GDP Dynamics
Investors received a slowing economy and unexpectedly accelerating inflation, which makes it more complicated for the Fed. It needs time to reflect and gather new data. It's no wonder that the chances, as indicated by CME derivatives, of the Fed cutting the federal funds rate in June fell from 18% the day before the important release to 13%, and in July, from 43% to 38%. The futures market extended a helping hand to the EUR/USD bears.
Wells Fargo believes that the GDP report raised the possibility that the US economy might be heading for stagflation, where prices are significantly higher than what Fed Chair Jerome Powell and his colleagues would prefer, while the economy loses steam. Essentially the same thing happened in the UK at the beginning of the year, and its currency, the pound, felt very confident. Should we be surprised by the dollar's success?
Key Indicators from the US GDP Report
Thus, the market's initial reaction was to be shocked; however, EUR/USD is gradually recovering. If the divergence in economic growth between the US and the Eurozone diminishes, bulls shouldn't throw in the towel just yet. The latest data on German business activity, business climate, and consumer confidence indicate positive shifts in the German economy. Meanwhile, France continues to remain the workhorse of the currency bloc. Let's see if the euro can capitalize on this.
Once the GDP fervor subsides, investors will focus on the Personal Consumption Expenditure data – the Fed's preferred inflation gauge. According to Bloomberg experts' forecasts, the March PCE is expected to accelerate from 2.5% to 2.6% on an annual basis and maintain its previous 0.3% monthly growth. This isn't the kind of dynamic that will make everyone rush to the US dollar.
Technically, the formation of a daily EUR/USD candlestick with a long upper shadow shows the bulls' weakness. They failed to lift the pair's quotes out of the previously defined consolidation range of 1.061–1.071. Furthermore, if the euro falls below $1.068, it will catalyze a peak towards its lower boundary and serve as a trigger for selling.
The material has been provided by InstaForex Company - www.instaforex.com
EUR/USD: trading plan for the US session on April 25th (analysis of morning deals). The dollar is ready for GDP data
2024-04-25 17:02
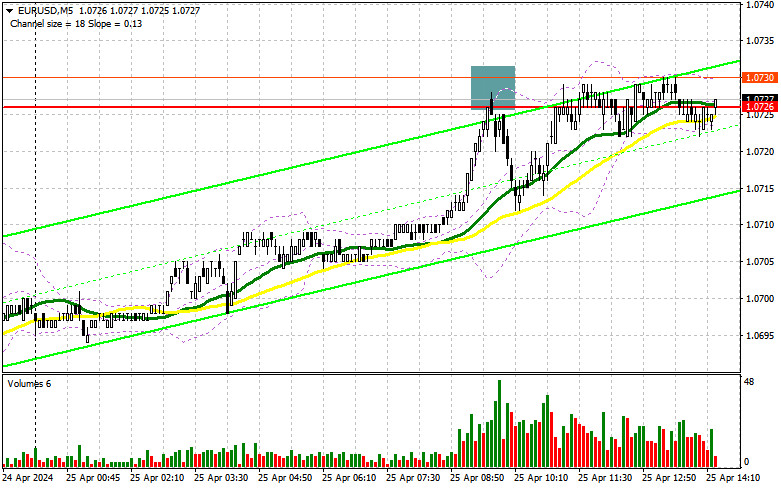
In my morning forecast, I pointed out the level of 1.0726 and planned to make decisions based on it for market entry. Let's take a look at the 5-minute chart and analyze what happened there. Growth and the formation of a false breakout led to a signal to sell the euro, resulting in a 15-point drop in the pair, which was the end of it all. The technical picture was reviewed for the second half of the day.
To open long positions on EURUSD, the following is required:
German data pushed the euro up in the first half of the day, but significant growth of the pair did not occur. Ahead are GDP data, and I will act as follows: good statistics will lead to a sharp decline in the euro and a rise in the US dollar, so I do not expect any significant buyer activity around 1.0717. Only a false breakout there, along with weak US data, will provide an entry point for long positions capable of pushing the euro towards the significant resistance at 1.0754. A breakout and a new high above this range will lead to the formation of a new bullish market and a buy signal with a chance to surge to 1.0779. The ultimate target will be the maximum at 1.0798, where I will take profit. In the scenario of a decline in EUR/USD and the absence of activity around 1.0717, as well as US GDP growth above economists' forecasts, pressure on the euro within the bearish trend will return. In this case, I will enter the market only after a false breakout around the next support at 1.0639. I plan to open long positions immediately on a rebound from 1.0601 with a target of a 30-35 point upward correction within the day.
To open short positions on EURUSD, the following is required:
Euro sellers have all the chances for a further decline in the pair, but, as you understand, strong US statistics are needed for this. In case of growth, bears will have to show themselves around 1.0754, and a test there may occur soon. Formation of a false breakout there will be an excellent scenario for entering short positions with a target of a decline to around 1.0717. A breakout and consolidation below this range, along with a reverse bottom-up test, will provide another selling point, with the pair moving towards 1.0682, which will return to the bearish trend. There, I expect more active involvement of large buyers. The ultimate target will be the minimum at 1.0639, where I will take profit. In case of upward movement of EUR/USD in the second half of the day, as well as the absence of bears at 1.0754, bears will say goodbye to hopes of regaining control of the market. In this case, I will postpone sales until testing the next resistance at 1.0779. There, I will also sell, but only after an unsuccessful consolidation. I plan to open short positions immediately on a rebound from 1.0798 with a target of a 30-35 point downward correction.
Indicator Signals:
Moving Averages
Trading is above the 30 and 50-day moving averages, indicating further pair growth.
Note: The author considers the periods and prices of moving averages on the hourly chart H1 and differs from the general definition of classic daily moving averages on the daily chart D1.
Bollinger Bands
In case of a decline, the lower boundary of the indicator, around 1.0682, will act as support.
Description of Indicators
- Moving average (determines the current trend by smoothing volatility and noise). Period 50. Marked in yellow on the chart.
- Moving average (determines the current trend by smoothing volatility and noise). Period 30. Marked in green on the chart.
- MACD indicator (Moving Average Convergence/Divergence - convergence/divergence of moving averages) Fast EMA period 12. Slow EMA period 26. SMA period 9.
- Bollinger Bands (Bollinger Bands). Period 20.
- Non-commercial traders - speculators, such as individual traders, hedge funds, and large institutions, use the futures market for speculative purposes and meet certain requirements.
- Long non-commercial positions represent the total long open position of non-commercial traders.
- Short non-commercial positions represent the total short open positions of non-commercial traders.
- The total non-commercial net position is the difference between the short and long positions of non-commercial traders.